Reasoning with Maps: Assessing Spatial Comprehension on Maps in Pre-trained Models
Map reasoning is an intuitive skill for humans and a fundamental skill with important applications in many domains. In this project, we aim to evaluate the capabilities of contemporary state-of-the-art Large Vision-Language Models (LVLMs) for reasoning on maps and comparing their capabilities with human participants on the coregistration task. We additionally propose and release a novel dataset to serve as an initial benchmark for map reasoning capabilities. We run an extensive analysis on the performance of open-source LVLMs showing that they struggle to achieve good performance on our dataset. Additionally, we show that coregistration is intuitive to human participants that were able to achieve close to perfect accuracy in a time-constrained manner.
Motivation
Humans possess a remarkable ability to intuitively understand and make sense of maps, demonstrating a fundamental capacity for spatial reasoning, even without specific domain knowledge. To illustrate this, consider the following question: Do these two maps represent the same location?
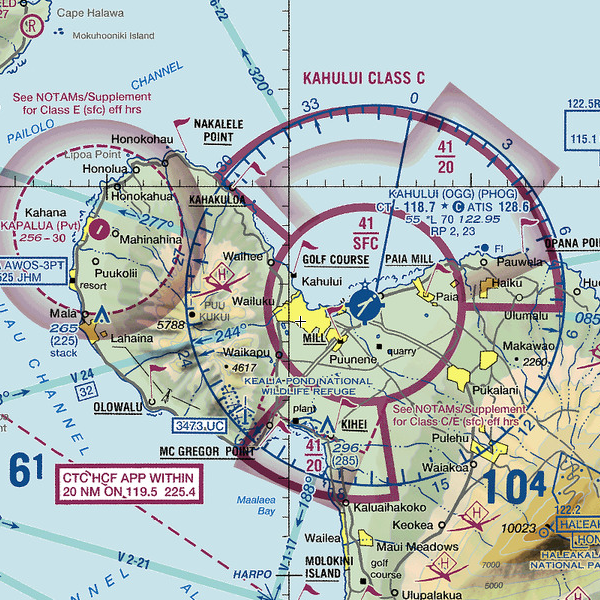
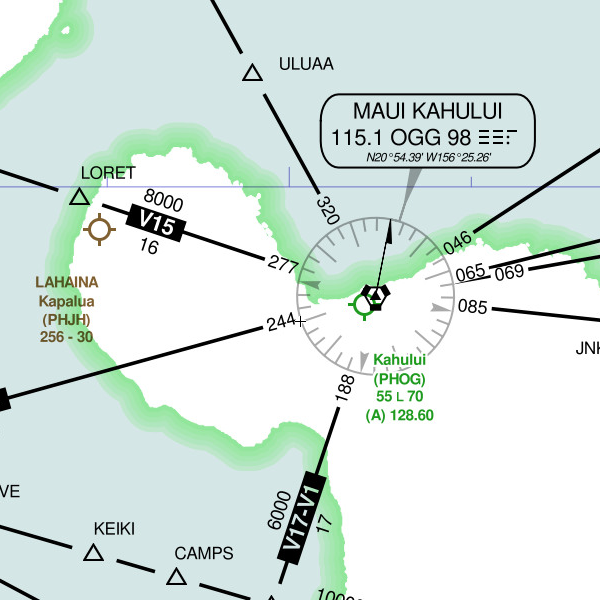
Answering this query necessitates coregistration, the ability to align two maps by overlaying their significant landmarks or key features. Moreover, humans can go beyond mere alignment; they can tackle complex inquiries that demand aligning maps, extracting pertinent data from each, and integrating this information to provide answers.
Maps reasoning is a fundamental skill with important applications in domains such as navigation and geographic analysis. For example, pilots need to be able to reference and understand multiple kinds of FAA charts as a core prerequisite for many aviation-related tasks. Further, making inferences on historical maps that lack digitized versions relies on human capabilities for reasoning on maps and is crucial for various fields such as geology or archeology. Machine learning models that can match human visual map understanding hold substantial promise in these applications. Additionally, such models have the potential to enhance accessibility by providing alternative modalities for individuals with visual impairments to comprehend and extract spatial information from maps.
Our work aims to tackle the following question: To what degree do contemporary state-of-the-art (SOTA) machine learning models, pre-trained on vast datasets comprising millions or even billions of images, possess the capacity for spatial reasoning and do they reach the human level? We will do this specifically by focusing on the task of coregistration.
We propose a map reasoning dataset which we believe is a suitable initial benchmark to test the capabilities of multimodal models on coregistration; The example given above about coregistration possibly cannot be answered directly using prior knowledge a Large Language Model (LLM) might have while ignoring the vision modality. Moreover, the complexity of the task can be increased and controlled, leading to a rigorous evaluation of the model’s ability to comprehend and synthesize information across textual and visual modalities.
Literature review and the gap in previous literature
Multimodality: There are countless significant recent advances in Large Language Models (LLMs) achieved by models such as Meta’s Llama 2
Recently there has been a massive push towards integrating other modalities into LLMs, most notably vision. Models such as Google’s Gemini
Vision-Language Benchmarks: There were significant strides made in the past years in developing benchmarks and datasets for LVLMs which are composed of questions that require both Language and Vision to successfully answer. However, there are very few datasets that include or focus on maps as part of the benchmark. LVLM-eHub
A frequently used dataset for evaluating LVLMs, which is also included in the Visual Reasoning benchmark, is the ScienceQA
An area closely related to maps that do have a relatively higher degree of focus is the capability of models to parse and reason about diagrams, figures, and plots. Datasets on this topic include the ACL-FIG
Maps Reasoning: Huge strides have been made in specific tasks related to maps, such as image-to-map
Our aim is to tackle the gap in assessing the map reasoning capabilities of LVLMs by developing a dataset aimed only at coregistration and analyzing the capabilities of existing models on such a dataset We focus our benchmark construction on the specific task of coregistration as it serves as an indicator of map reasoning capabilities and is one step towards constructing a comprehensive benchmark for map reasoning capabilities of LVLMs.
New Dataset
We have opted to create and compile a map dataset focusing on maps from the aviation domain for our research. The maps we utilized are carefully crafted by aviation agencies to provide a wealth of information while maintaining readability within a concise timeframe, ensuring clarity for pilots. Our dataset will be constructed by incorporating maps from the following sources:
-
World Visual Flight Rules (VFR): These maps are intended to guide pilots when they operate aircraft visually. They include aeronautical and topographic information such as airports, obstructions, and navigation aids.
-
World Instrument Flight Rules (IFR) Low These maps are suitable to assist pilots when they control the aircraft through instruments. They contain information such as cruising altitudes, route data, and controlled airspaces.
These maps are accessible in an interactive environment through the SkyVector website (VFR, IFR Low), which we used as part of our dataset generation pipeline.
To generate the map snippets for our experiment, we chose to sample from the previous map sources around airports. This selection guarantees that the snippets are inherently information-rich, given that the map originates in the aviation domain. To ensure diversity in our dataset, we specifically sampled airports situated in the states of Massachusetts, New York, Delaware, Arizona, and Hawaii.
The resulting dataset exhibits significant variations in terms of density, featuring both isolated airports and those nestled within cities, diverse locations such as inland, seaside, and islands, as well as various terrain types ranging from greenery landscapes, mountainous regions, and arid environments. In total, our dataset contains 1185 image pairs, each image is 600x600 pixels in PNG format. The total size of our dataset is 1.28 GB.
A glimpse of the coregistration task
To gain an understanding of our task and its intricacies, we present a few examples from our dataset. Generally, humans can successfully align two maps by identifying common features, which fall into one of the following categories:
- Terrains: such as shorelines or mountains.
- Charts: such as flight paths or restricted airspaces.
- Landmarks: such as airport or city names.
The process of mapping by terrain is typically swift for humans, especially when there are ample distinctive details. On the other hand, mapping by chart requires a more thoughtful approach, involving careful examination to establish a connection between the depicted attributes. Mapping by names usually serves as a last resort, employed if the prior approaches prove unsuccessful. Consider the following examples:
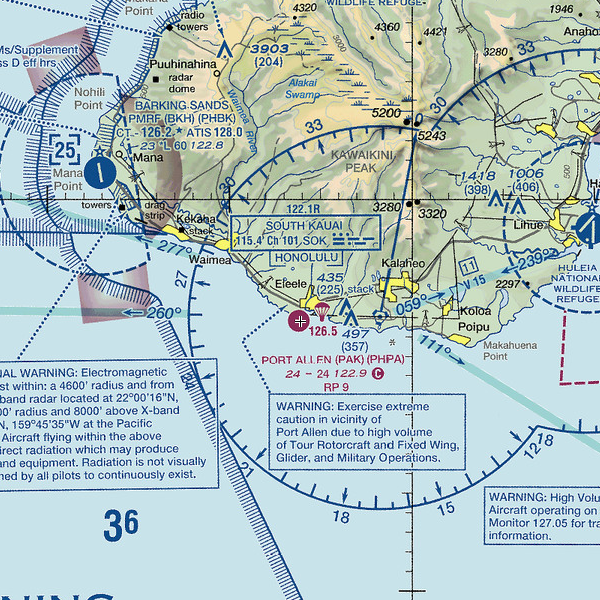
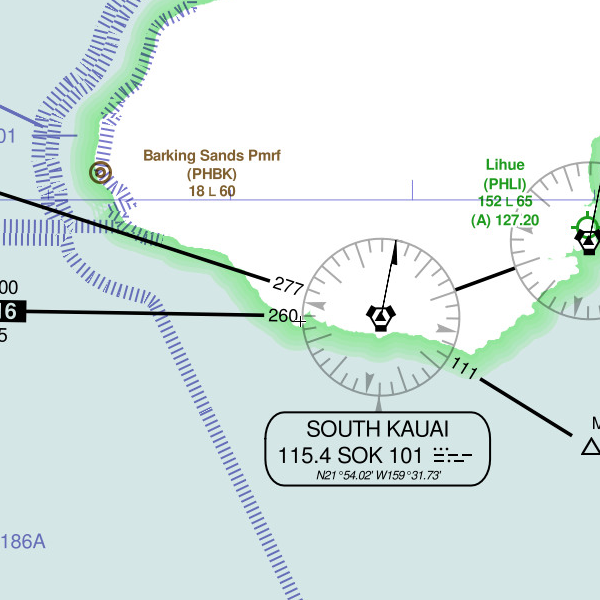
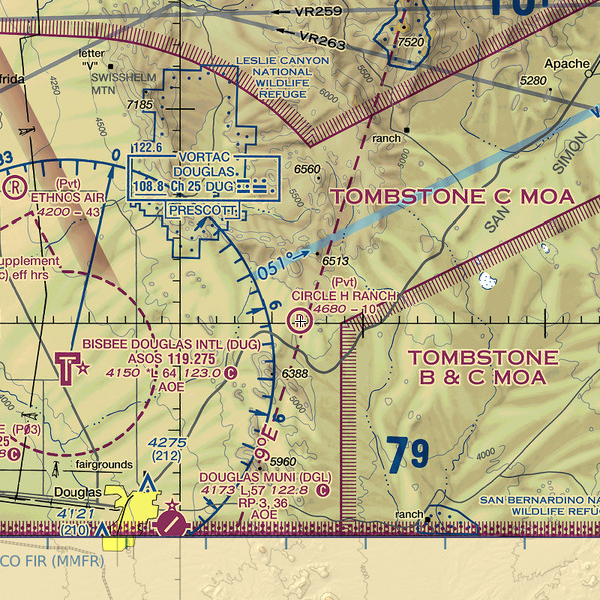
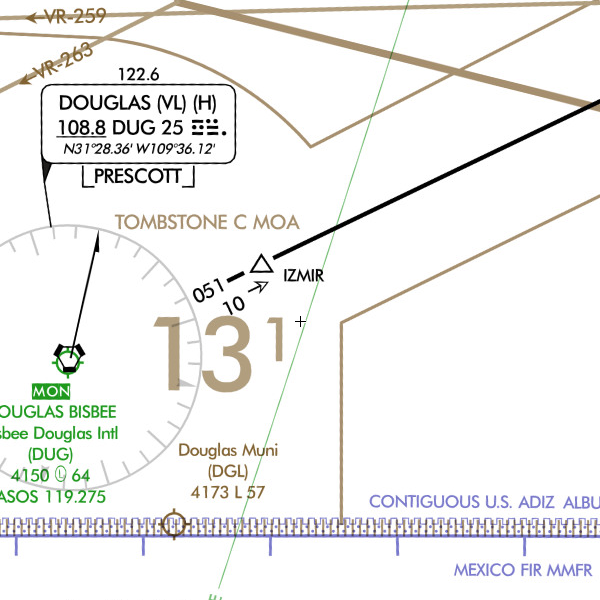
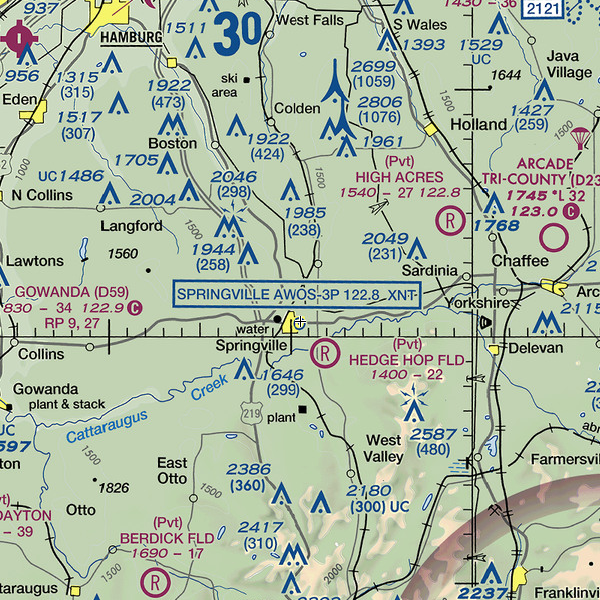
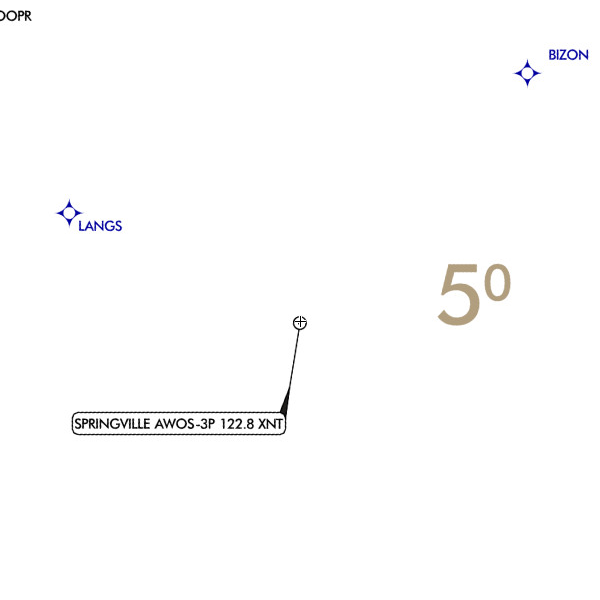
All of these examples are positive (the maps show the same location). We showcase below negative examples with varying complexity.
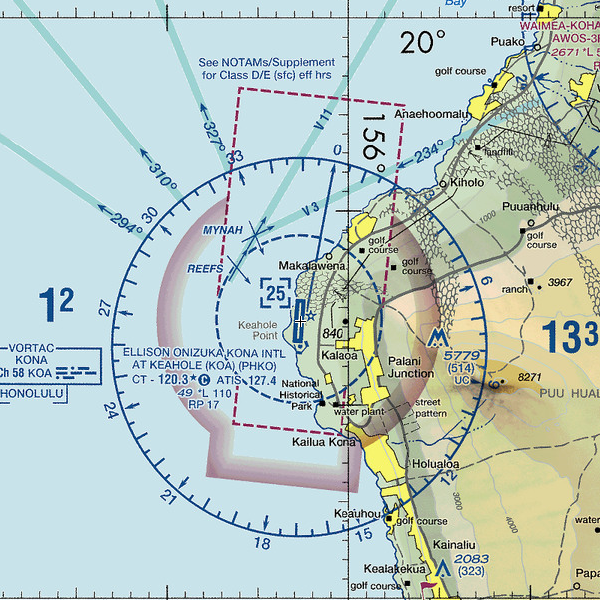
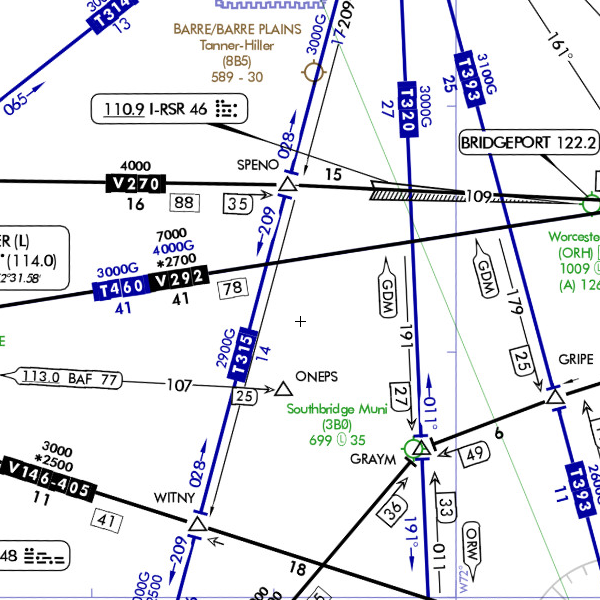
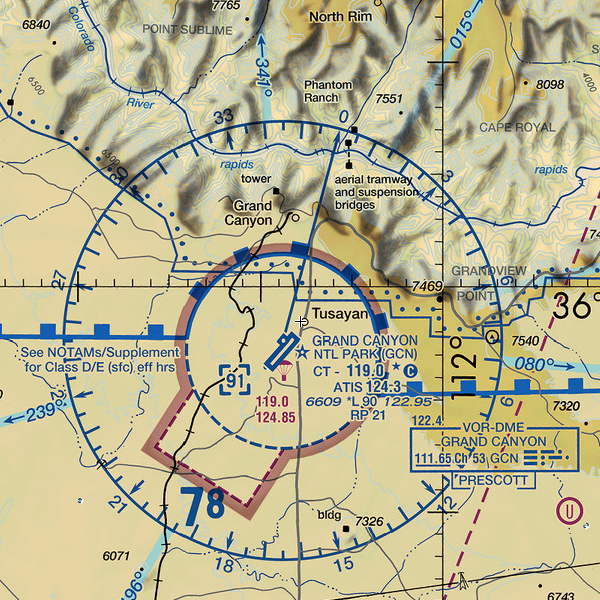
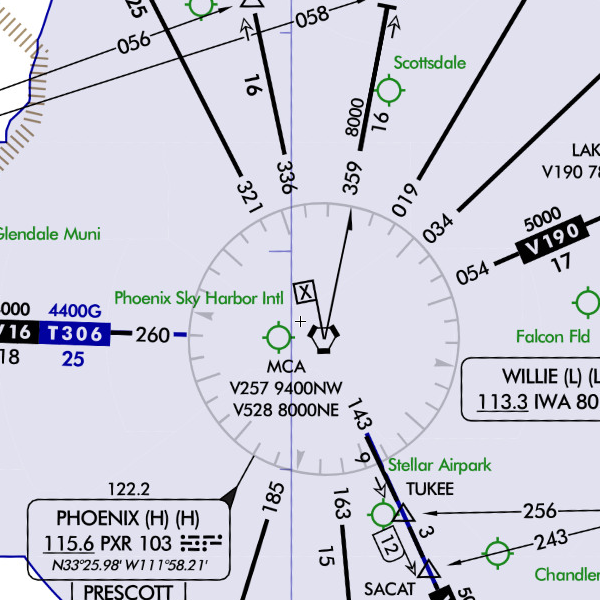
We showcase multiple positive and negative pairs alongside the natural reasoning that a human would take to correctly classify the pairs. We hope that this showcases the complexity of the task and the various strategies involved in achieving successful coregistration.
Experiments
Zero-shot evaluation
To start, we want to evaluate the zero-shot performance of pre-trained LVLMs on the task of identifying whether the two images are the same (coregistration). The models we start our evaluation with are BLIP-2
To verify that the models we obtained are behaving as expected and are capable of answering a textual question that relies on a visual component, we compile a very simple dataset of 200 cat and dog pictures, half the images depict a cat while the other half depict dogs. We present these trivial images to the models alongside the prompt “Is this an image of a cat? Answer:” and generate a single token. As expected, out of the 200 images all four models achieved an almost perfect classification accuracy (>95% for all 4 models) by answering with either a “Yes” or a “No” token.
This is not surprising because, as mentioned, object recognition questions are very prevalent in visual question-answering datasets, especially on ubiquitous everyday objects such as cats and dogs. To see if these models can generalize beyond their training datasets and properly reason on maps, we start by running the following experiment:
Experiment #1: For each VFR and IFR image pair, we generate two examples (positive and negative). For the positive example, we use the correct pairing (e.g., maps from the same location with the two different styles). For the negative example, we randomly replace one map uniformly from our datasets. Each model is provided with a concatenation of the two maps in its vision input, and with the question “Do these two maps show the same location? Answer with “Yes” or “No”. Answer:” in its text input.
In total, each model was asked 2370 questions. Below, we show the accuracy, precision, and recall that each model obtained.
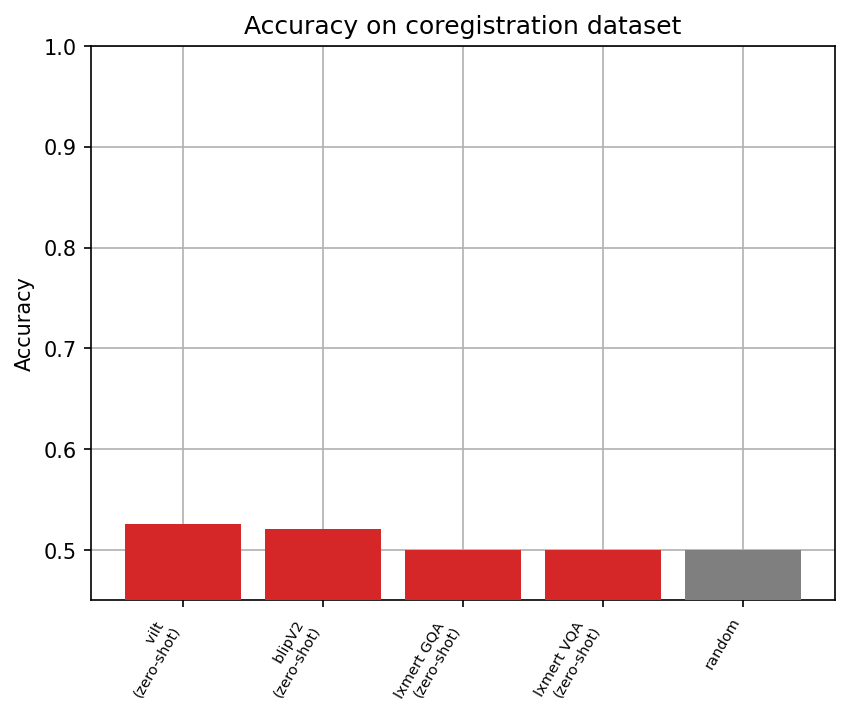
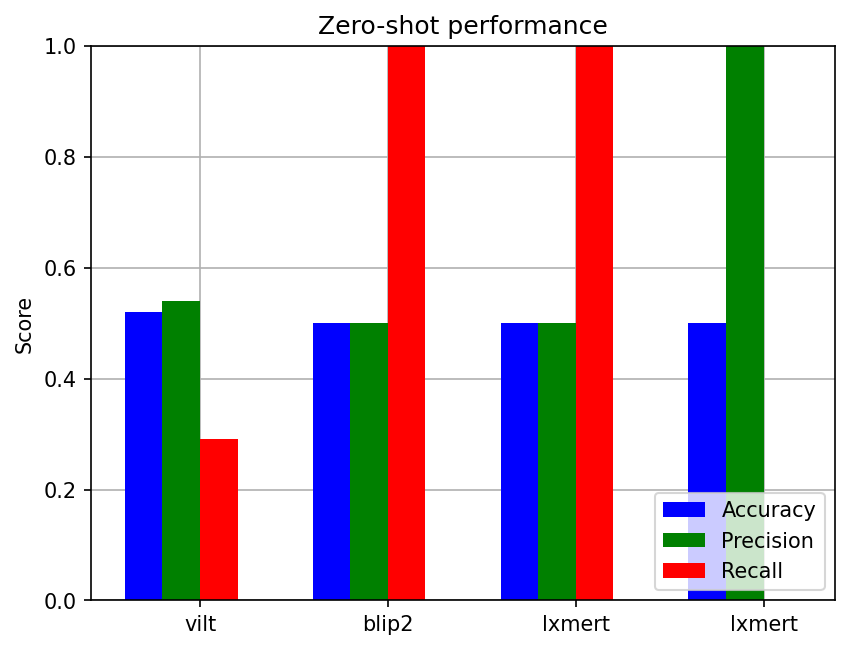
The models performed barely above random guessing in the zero-shot experiment, and some models consistently produced the same single output (either “yes” or “no”) regardless of whether the input image was a positive or negative pair.
While the results of the models are very low and barely above random guessing, we wanted to analyze whether this failure is due to the model not comprehending the task or whether the issue is simply in the last layer of the model where the text generation occurs. The reason behind this analysis is that there is a possibility that the LVLM is able to correctly capture all the features necessary for determining whether the two maps coregister while still failing at providing the final answer due to the final layer of the model outputting an incorrect distribution over the labels (or tokens in the case of LVLMs). Thus we decide to ignore the last linear layer of the model (the language model head) and capture the hidden state of the last token from the last layer of the model.
Fine-tuned evaluation
Using this methodology, the output we obtain from each model is a single embedding vector (the length of which depends on the embedding size of the model). Usually, a single linear layer is finetuned on the last layer to directly predict the answer. However, we opt for a more detailed analysis by training multiple classifiers (Logistic Regression, SVM, and XGBoost) that take the embedding vector and produce a binary output. In all the upcoming figures, we always report the results using the classifier that performed the best (for each model) on the validation set.
Moreover, it is known that LLMs can be sensitive to prompts
This methodology of using the model to extract a rich embedding that contains the answer to our prompt (instead of generating the answer directly as text) means that we are now capable of utilizing additional large transformer-based multimodal models that output an embedding vectors instead of directly outputting text. Thus we include in our analysis two such models which are FLAVA
Experiment #2: We generate the examples using the same procedure described in Experiment #1. Then, for each model, we pass through the entire dataset and generate an embedding for each sample in our dataset. We then train the simple classifiers on 70% of the embedding vectors to predict the positive and negative pairs. We report the evaluation on the other 30% data and report the results in orange below.
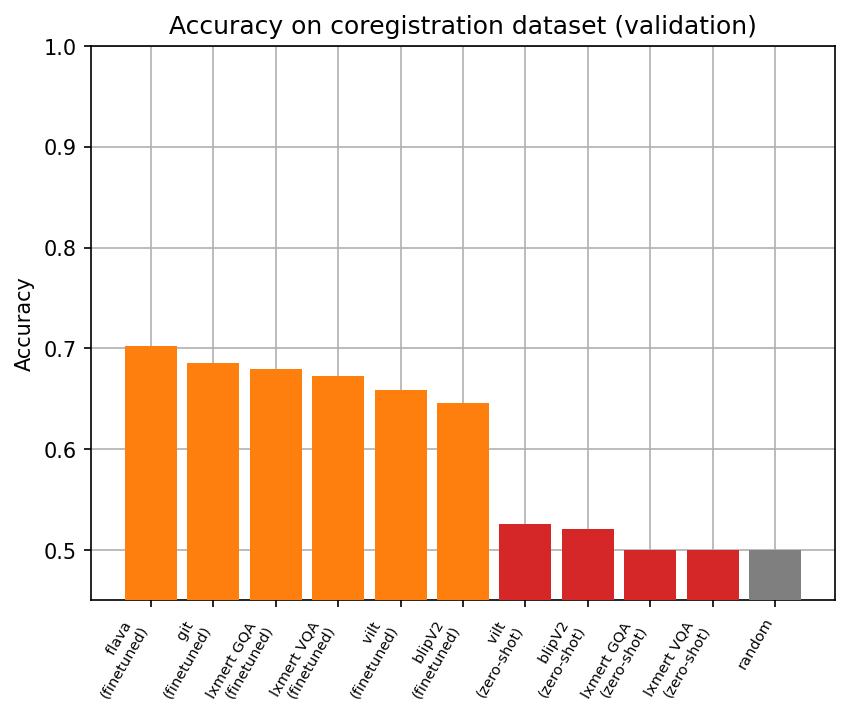
The accuracy of this fine-tuning methodology (shown in orange) achieves around 65%-70% for all models which is a significantly higher accuracy compared to the zero-shot accuracy of the LVLMs (shown in red) which was incapable of achieving more than 55%. This experiment shows that the embedding of the last token does contain a slightly more feature-rich representation of the multimodal input and can be used to classify the positive/negative pairs at a higher rate than random but is overall still incapable of sufficiently solving the task.
Thus far we have tried to assess the capabilities of LVLMs and (more generally) Multimodal Vision Language models on solving the coregistration task, and we assessed this capability using our constructed dataset of determining whether two maps of different styles represent the same location or not. Given the low accuracy achieved on this task, we can claim that the LVLMs we have analyzed are incapable of reasoning and answering more complicated questions relative to our simple baseline question of “Are these two maps of the same location”
Improving results for co-registration
We emphasize that our goal is not to directly achieve high accuracy on this task by utilizing any machine learning model, but rather it is to evaluate the capabilities of LVLMs to reason on maps. Furthermore, we created and proposed this dataset and task to act as a baseline for assessing the reasoning abilities of LVLMs on maps.
However, despite the failure of LVLMs to answer this baseline task, we next want to assess the inherent difficulty of the dataset. For this, we develop a simple model by utilizing the same simple classifiers used above to train on the embedding of a unimodal vision-only model. Unlike LVLMs, we are not testing our proposed task-specific model on the dataset to assess its capabilities for reasoning on maps, as the model is not trained to answer questions based on images, does not accept text modality, and is specifically fine-tuned to solve this one narrow task. Thus, the results of this experiment serve only to give a sense of the difficulty of the task that we considered as a simple baseline for map reasoning. This will hopefully demonstrate that the relatively older frozen vision-only models can achieve a significantly higher accuracy on this specific task when compared to state-of-the-art open-source LVLMs and possibly indicating the gap between the embeddings captured by the vision-only model and the LVLMs.
Experiment #3: We develop a simple unimodal vision classification model by utilizing a frozen CLIPVIsion model as a backbone. First, we feature-engineer the input by subtracting the two maps from each other in the image space to produce a single image. This image is passed through the frozen CLIPVision model to generate an embedding of the difference between the maps, the embeddings are then used to train the simple classifiers mentioned above and the one that achieves the highest accuracy on the validation set is reported below.
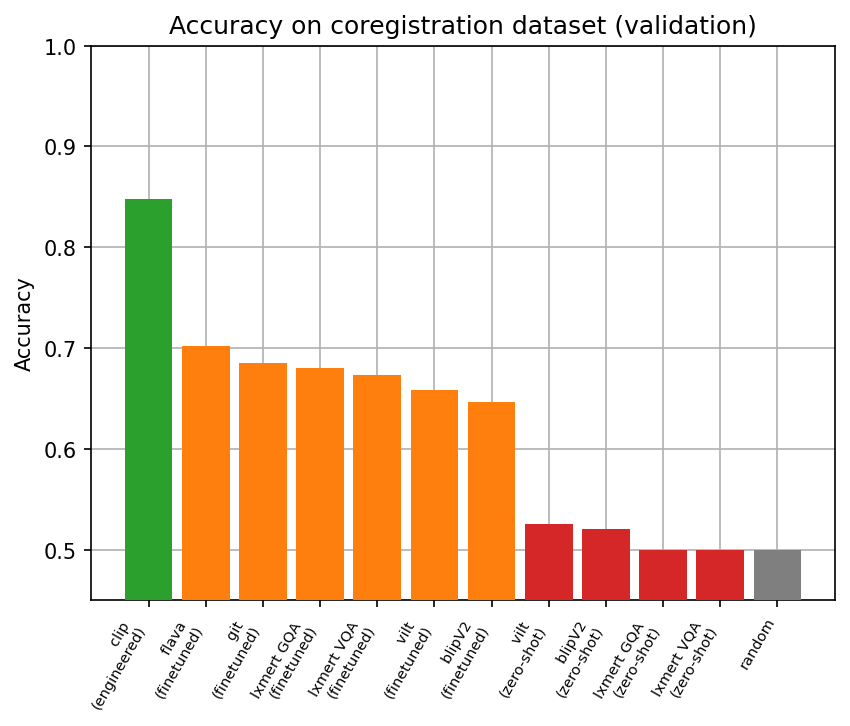
We see that our fine-tuned vision model (shown in green) achieves a significantly higher accuracy than all previously tested LVLMs. This shows that the task is not a significantly difficult vision task as a frozen CLIPVision model with a head fine-tuned on approximately two thousand samples was able to sufficiently extract an embedding and correctly distinguish positive and negative pairs 85% of the time.
This significant difference between the accuracy of the frozen CLIP model and the LVLMs on this task signifies that the LVLMs we tested are still significantly farther behind on certain tasks even when compared to a frozen vision-only model that was trained and released years prior. This is in stark contrast to the significant achievements that LLMs accomplish on numerous datasets when compared to task-specific NLP models, where the highest-scoring models on most NLP datasets are LLMs.
Human benchmarking
So far, we have examined the performance of pre-trained LVLMs on our proposed dataset in a zero-shot as well as a fine-tuned manner alongside a vision-only model with feature engineering to assess the difficulty of the task.
A natural next question to analyze is the performance of humans on this same task as it is not immediately clear how hard or easy the task is for us. The performance achieved by humans on a task such as this would serve as a great target for LVLMs to try to reach.
Experiment #4: We present the following task to two subjects. Each human subject will see two maps for 10 seconds. The pair can be positive or negative with equal probability. After the 10 seconds elapse, the maps automatically disappear and the human subject is asked if the two maps show the same location with a binary “Yes” or “No” choice. After the answer is received, a new pair is sampled and this process is repeated until we gather 50 answers from each human subject.
The 10-second window acts as a pseudo-computational limit on the human subject and ensures that the subject’s answers are mostly based on visual and spatial reasoning and not on reading and comparing text. If the subject does not immediately identify a visual or spatial cue, the 10-second window possibly allows for a maximum of one or two texts to be compared if the subject is quick enough. This time limitation prevents the participants from spending an extensive amount of time comparing the nuances of the two images for a severely long time which would make the task more trivial. Below, we show the accuracy obtained from two human subjects and compare it with the previous LVLM results.
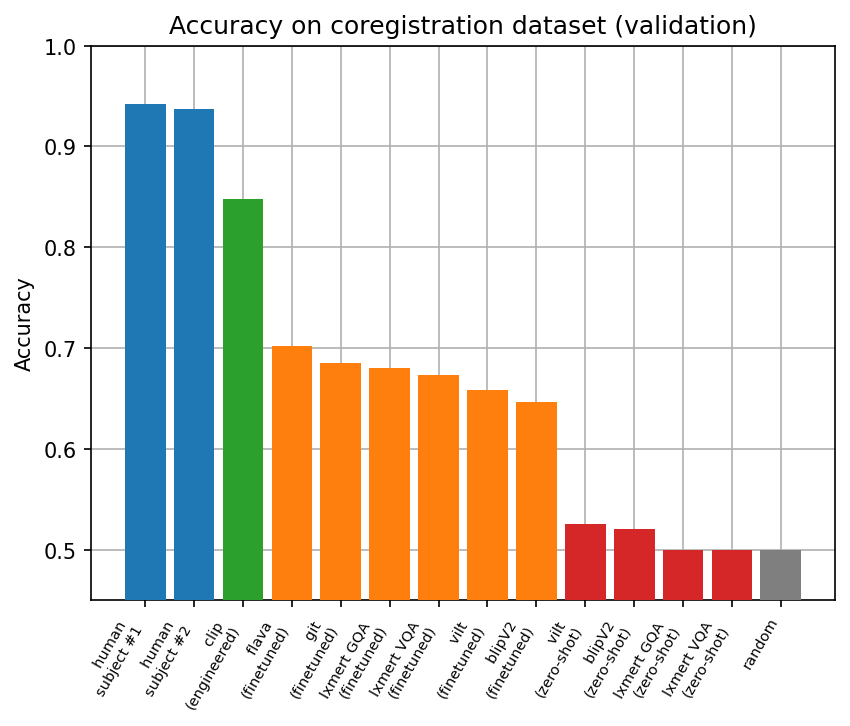
We see that both human participants (shown in blue) achieve a significantly higher accuracy (~95%) compared to all the tested ML models. This shows that the task is significantly easier for humans despite the 10-second time limit preventing the subject from extensively comparing the images.
Our experiments showcase the inability of LVLMs to properly solve our proposed dataset on coregistration as well as showing that a vision-only fine-tuned model with feature-engineering is able to solve the task at a significantly higher accuracy. Finally, we show that humans are able to solve the time-constrained task with a significantly high accuracy.
Analysis on prompt engineering
Numerous recent studies have indicated the importance of prompt engineering in the quality of the output of Large-Transformer based models
Due to the potential importance of prompts in affecting performance, we decided to run all experiments that require prompts using multiple different prompts with varying degrees of length and complexity. We note that the prompts considered and listed below were only the ones that consistently conditioned the model to output a “Yes” or “No” output token instead of any other arbitrary sentence completion output. The prompts are shown in the following table:
| ID | Prompt |
|---|---|
| 1 | Are these two maps the same? Answer with “Yes” or “No”. Answer: |
| 2 | Do these two maps show the same location? Answer with “Yes” or “No”. Answer: |
| 3 | Do the two charts depict the same area? Answer:” |
| 4 | The following image contains two maps with different styles side by side. Do the two maps show the same location? Answer with “Yes” or “No”. Answer: |
| 5 | On the left there is a map from the VFR dataset and on the right a map from the IFR dataset. Do the two maps show the same location? Answer with “Yes” or “No”. Answer: |
| 6 | There are two maps of different styles, do they represent the same area or are they completely different? Answer: |
| 7 | The following image contains two maps with different styles side by side. Do the two maps show the same location? Try to compare the maps by looking at key landmarks or features. Answer with “Yes” or “No”. Answer: |
| 8 | Carefully examine the following two images that contain two maps with different styles side by side. Do the two maps correspond on the same latitude and longitude point? It is of utmost importance that you answer this correctly. Answer with “Yes” or “No”. Answer: |
The initial prompts (prompts #1 - #3) are meant to be short and direct, while the ones in the middle (prompts #4 - #6) are more verbose and add a bit more complexity, while the last two (prompts #7 - #8) are very verbose and add an exact explanation of the task. We also include additions to some of the prompts that try to guide the models on how they accomplish the task, and some additions that emphasize the importance of correct answers. In the figure below, we study the effect of prompts on model performance.
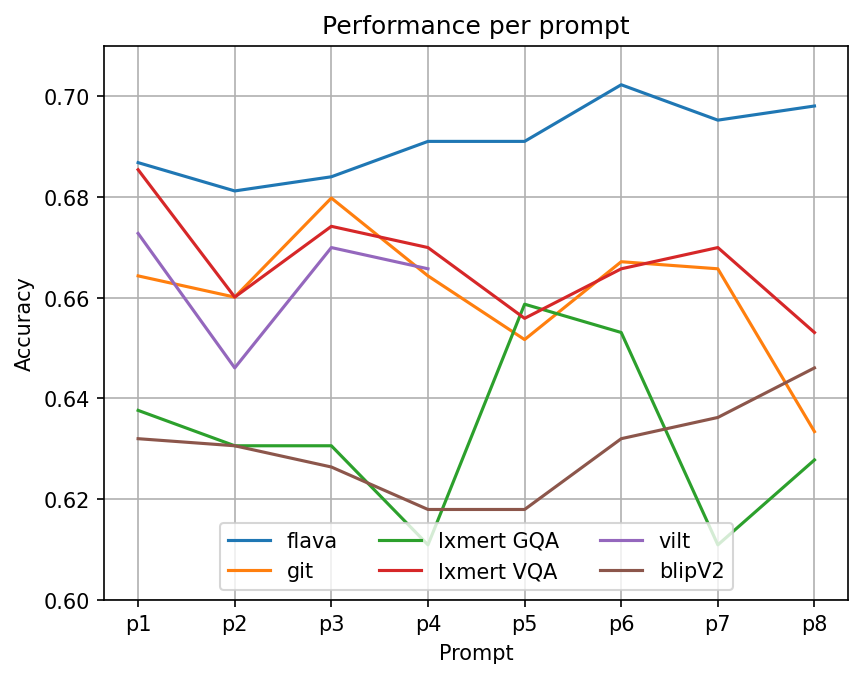
We notice that varying the prompts has a relatively high variance in terms of accuracy with an improvement of less than 5% for all models across all prompts. Still, there are no strong general trends across models when considering prompts with increasing complexity. We note that the VILT model was incapable of accepting prompts #5 - #8 due to the limitation of its maximum context length which is shorter than the other models.
One aspect that might limit this analysis is that almost all prompts contain an explicit requirement for the models to provide answers immediately (e.g., “Answer with ‘Yes’ or ‘No’. Answer:”). This was done to reduce the computational inference cost and avoid generating long sequences of texts. The models might respond better to some prompts if they were allowed to reason about their answers first.
Investigating the failure points of LVLMs on coregistration
The figures presented in the beginning of the blog post demonstrating some examples in our proposed dataset give a clue of the variance in the difficulty of the examples in the dataset, where some samples are easy to identify as positive pairs and others much harder to do so.
Thus, to get a better insight into the model’s performance and investigate its failure points, we investigate some examples where the models made confidently wrong predictions. Here, we focus on a single model, FLAVA, which was our best-performing LVLM. In the figure below, we investigate both false positives with the highest predicted positive label and false negatives with the highest predicted negative label. The figure contains the 9 examples where the model generated a very high (very low) score while the true label was positive (negative).
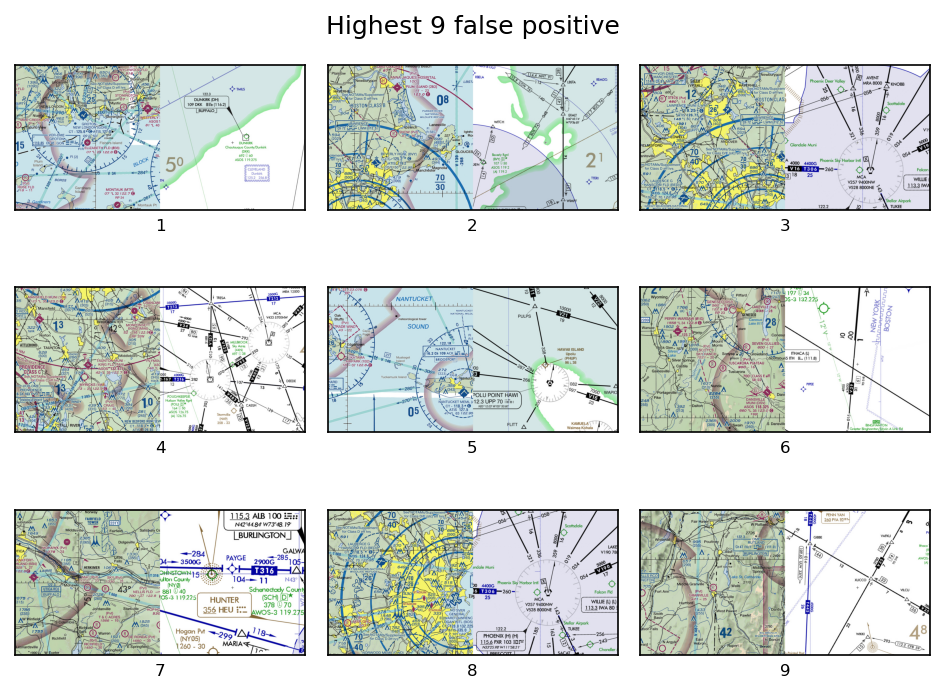
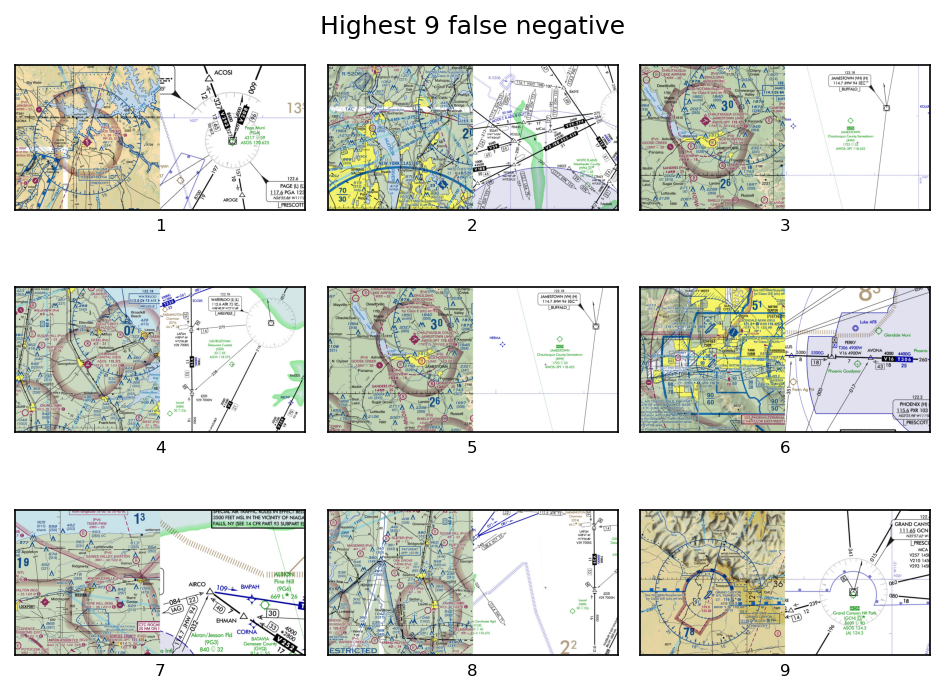
For the false positives, we see more than one example where two maps containing water were wrongly classified. This might indicate that the model is making predictions on these images based on colors more so than spatial reasoning. For the false negatives, there are many examples where the VFR chart is dense while the IFR is sparse. These examples require discarding a lot of information from the VFR charts and focusing solely on the region where the IFR chart contains information. Given that the model made wrong decisions in these examples, there might be a preference for positively matching images based on density. Notably, some of these examples were straightforward for the human subjects (matching based on the shoreline), while other examples required more effort (matching between dense and sparse maps).
Discussion, Limitations, and Future Work
One of the key takeaways of our experiments, and specifically from contrasting the first two experiments with the third experiment, is that it was not difficult for a non-LVLM model to achieve an 85% accuracy on our proposed dataset. Yet, our dataset proved to be challenging for LVLMs, especially in zero-shot performance where they achieved almost no better than random guessing. This implies that it would be beneficial to further expand future datasets that are used for LVLM training and specifically the addition of data collection similar to what we propose and that this could provide invaluable improvements to future training of LVLMs.
Existing vision-language benchmarks exhibit a heavy focus on real-world objects and scenes, with a distinctive lack of images and questions on maps. This is despite the fact that maps are ubiquitous and used in many real-world scenarios. Furthermore, many maps are easily accessible in digital format and ready to be integrated into vision-language benchmarks. We believe such inclusion would require relatively little effort in terms of data collection while providing significantly higher capabilities for LVLMs.
We plan to expand the size of our new dataset used in this project and to make it publicly available. Additionally, while our current project primarily focused on the coregistration tasks, we have plans to incorporate more intricate and challenging questions that delve deeper into map reasoning.
There are some limitations to the current analysis done in this project. A significant limitation is the computational limit preventing us from feasibly generating answers from the LVLMs in an autoregressive manner instead of our analysis which used only one output token per sample. A possible future work is examining more complicated generation methods such as Chain of Thought
Another limitation is that we were only capable of running our analysis on open-source models, the largest model tested was blip-2 with less than 3 billion parameters. This was the largest LVLM that we had access to in terms of weights, to be able to run our analysis on. Future work could attempt to run the analysis on larger closed-source models if access is granted.
Conclusion
In this project, we propose a novel dataset to serve as an initial benchmark for the capabilities of LVLMs to reason on maps with the goal of addressing a gap in current LVLM benchmarks and datasets.
Using this dataset, we run an extensive analysis on the performance of open-source LVLMs showing that they struggle to achieve good performance on the coregistration task. Additionally, we show that the task for our dataset is a relatively simple vision task by showing that a fine-tuned vision-only model released years prior to the tested LVLMs achieves a significantly higher accuracy. Finally, we show that the coregistration task is intuitive to humans, as participants were able to achieve close to perfect accuracy even in a time-constrained manner.
We hope that future initiatives regarding data collection for LVLMs and training foundational LVLMs will put more emphasis on datasets such as our proposed datasets. This will hopefully unlock new capabilities for LVLMs enabling them to advance beyond their current limitations and possibly expand their utility and reasoning abilities in a variety of real-world scenarios.