A Deeper Look into Equivariance for Materials Data
A Comparative Analysis of an E(3) Equivariant GNN and a Non-Equivariant GNN in Materials Data Tasks with a Focus on Investigating the Interpretability of Latent Geometry within the Two GNNs.
Introduction
Materials embody a diverse array of chemical and physical properties, intricately shaping their suitability for various applications. The representation of materials as graphs, where atoms serve as nodes and chemical bonds as edges, facilitates a systematic analysis. Graph Neural Networks (GNNs) have emerged as promising tools for deciphering relationships and patterns within materials data. The utilization of GNNs holds the potential to develop computational tools that deepen our understanding and aid in designing structure-property relationships in atomic systems.
In recent years, there has been a heightened focus on employing machine learning for the accelerated discovery of molecules and materials with desired properties [Min and Cho, 2020; Pyzer-Knapp et al, 2022; Merchant et al, 2023]. Notably, these methods are exclusively applied to stable systems in physical equilibrium, where such systems correspond to local minima of the potential energy surface $E(r_1, . . . , r_n)$, with $r_i$ representing the position of atom $i$ [Schüttet al, 2018].
The diverse arrangements of atoms in the system result in varying potential energy values, influencing chemical stability. In the GIF below, different trajectories can be seen of the molecule Ethane. The Ethane molecule spends 99% of its time in a specific conformation, in which the substituents are at the maximum distance from each other. This conformation is called the staggered conformation. Looking at the molecule from a position on the C-C (main) axis (as in the second half of the animation), The staggered conformation is reached when the H atoms of the front C atom are exactly between the H atoms of the other C atom. This animation also show the 3-fold symmetry of the molecule around the main axis. All three staggered conformations will have the same energy value, as they are completely equivalent. The intermediate conformations will result in a higher energy value, as they are energetically less favorable. Different conformations can also portray elongations of some bonds lengths and variations in angles value. Predicting stable arrangements of atomic systems is in itself an important challenge!
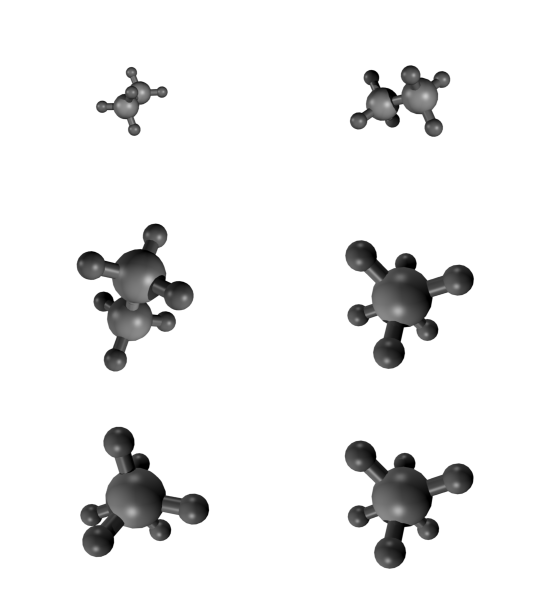
In the three-dimensional Euclidean space, materials and physical systems in general, inherently exhibit rotation, translation, and inversion symmetries. These operations form the E(3) symmetry group, a group of transformations that preserve the Euclidean distance between any two points in 3D space. When adopting a graph-based approach, a generic GNN may be sensitive to these operations, but an E(3) equivariant GNN excels in handling such complexities. Its inherent capability to grasp rotations, translations, and inversions allows for a more nuanced understanding, enabling the capture of underlying physical symmetries within the material structures [Batzner et al, 2022].
Data
The MD 17 dataset, an extensive repository of ab-initio molecular dynamics trajectories [Chmiela et al, 2019], was employed in this study.
Each trajectory within the dataset includes Cartesian positions of atoms (in Angstrom), their atomic numbers, along with total energy (in kcal/mol) and forces (kcal/mol/Angstrom) acting on each atom. The latter two parameters serve as regression targets in analyses.
Our focus narrowed down to the molecules Aspirin, Ethanol, and Toluene:
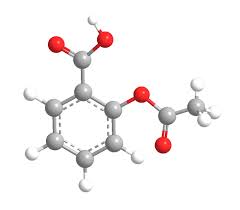
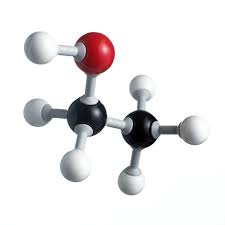
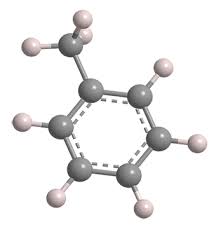
The distributions of energy values (kcal/mol) for various conformations of the three molecules, within the training and validation sets, are illustrated in the histograms below.
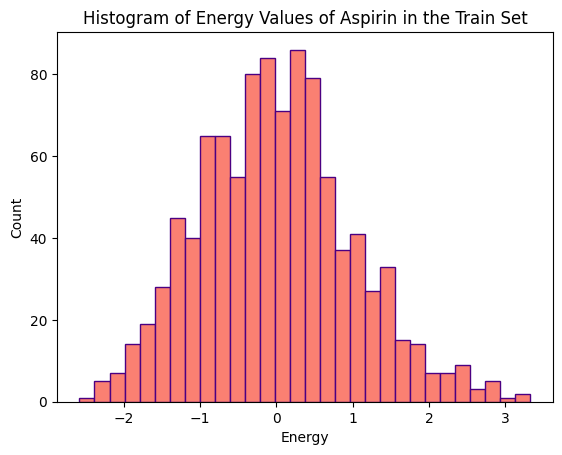
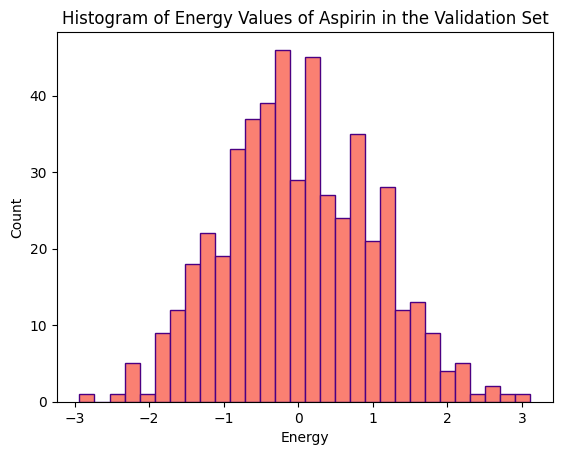
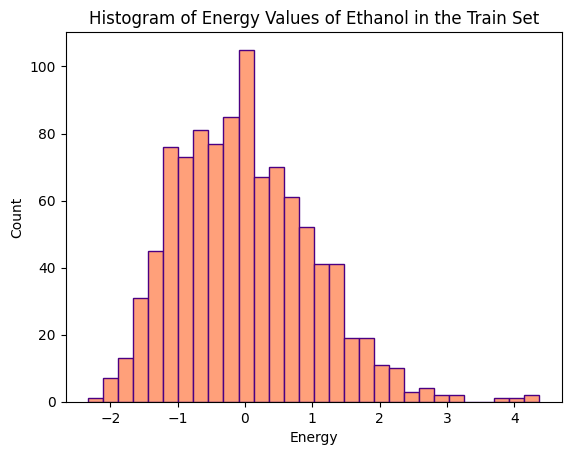
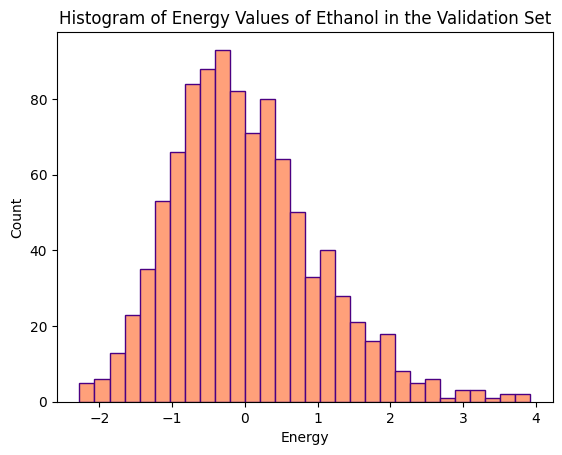
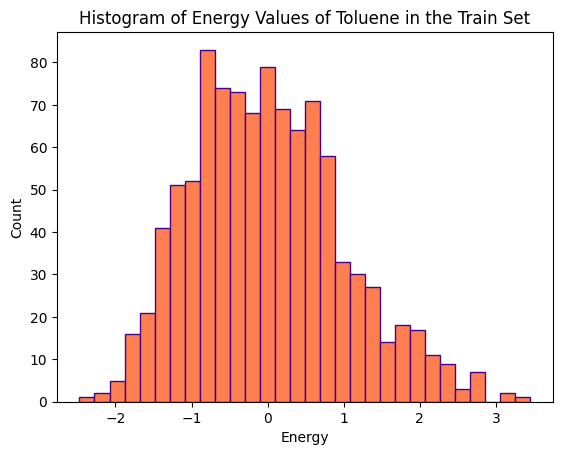
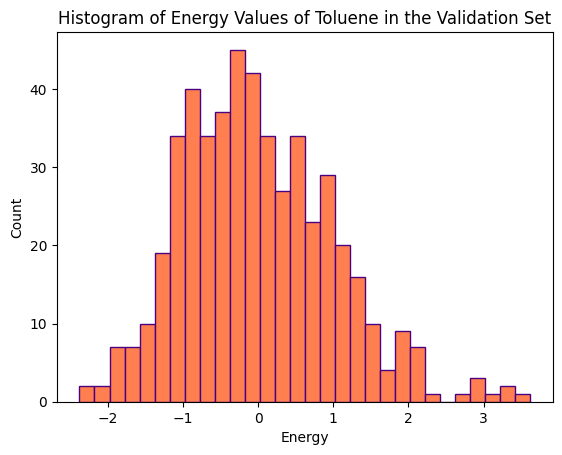
The training set for Aspirin comprises 1000 conformations, while its validation set consists of 500 conformations. Ethanol’s training and validation sets each consist of 1000 conformations. Toluene’s training set comprises 1000 conformations, and its validation set consists of 500 conformations.
Method
In this project, our objective is to conduct a comparative analysis of two Graph Neural Network (GNN) architectures: an E(3) equivariant network and a non-equivariant (specifically E(3) Invariant) one. The primary focus is on energy prediction tasks related to atomic systems, with a particular emphasis on exploring the distinctions within the latent representations of these architectures and their interpretability.
All GNNs are permutation invariant by design [Keriven and Peyr, 2019]. Our baseline GNN for comparison achieves rotation and translation invariance by simply operating only on interatomic distances instead of absolute position of the atoms. This design choice ensures that both the output and internal features of the network remain invariant to rotations. In contrast, our equivariant GNN for comparison utilizes relative position vectors rather than distances (scalars) together with features comprised of not only scalars, but also higher-order geometric tensors.
In our Invariant GNN, the node-wise formulation of the message passing is given by:
Where $ x_i, x_j $ are the feature vectors of the target and source nodes, respectively, defined as a one-hot representation of the atomic number of that node. The summation is performed over the neighborhood $\mathcal{N}(i)$ of atom $i$, defined by a radial cutoff around each node, a tunable parameter typically set around 4-5 angstroms. Meaning, the concept of neighborhood is based on the distance between nodes, not their connectivity. Additionally, $ d_i = 1 + \sum_{j \in \mathcal{N}(i)} e_{j,i} $ where $ e_{j,i} $ represents the edge weight from the source node $j$ to the target node $i$ , and is defined as the interatomic distance.
For constructing our equivariant GNN, E3nn was employed - a torch-based library designed for building o(3) equivariant networks. Following the method presented in [Batzner et al, 2022], a neural network that exhibits invariance to translation and equivariance to rotation and inversion was constructed. Two key aspects of E3nn facilitating the construction of O(3) equivariant neural networks are the use of irreducible representations (Irreps) for data structuring and encapsulating geometrical information in Spherical Harmonics. Irreps are data structures that describe how the data behaves under rotation. We can think of them as data types, in the sense that this structure includes the values of the data alongside instructions for interpretation. The Spherical Harmonics form an orthonormal basis set of functions that operate on a sphere, and they’re equivariant with respect to rotations, which makes them very useful (and popular!) in expanding expressions in physical settings with spherical symmetry.
For the equivariant GNN, the node-wise formulation of the message is:
where $ f_j, f_i $ are the target and source nodes feature vectors, defined similarly as a one-hot representation of the atomic number. $z$ is the average degree (number of neighhbors) of the nodes, and the neighborhood $\partial(i)$ is once again defined using a radial cutoff. $x_{ij}$ is the relative distance vector, $h$ is a multi layer perceptron and $Y$ is the spherical harmonics. The expression $x \; \otimes(w) \; y$ denotes a tensor product of $x$ with $y$ using weights $w$. This signifies that the message passing formula involves a convolution over nodes’ feature vectors with filters constrained to be a multiplication of a learned radial function and the spherical harmonics.
Results
The performance of the two GNNs was compared for the task of predicting the total energy of the molecule’s conformation - a scalar property. By constraining the Equivariant GNN to predict a scalar output, it becomes overall invariant to the E(3) group. However, the use of higher order geometric tensors in the intermediate representations and operations in the E-GNN, makes internal features equivariant to rotation and inversion. This enables the passage of angular information through the network using rotationally equivariant filters (spherical harmonics) in the node feature convolution. This is the essential difference between the two architectures.
The learning curves of the two GNNs for each molecule data are presented in the figures below:
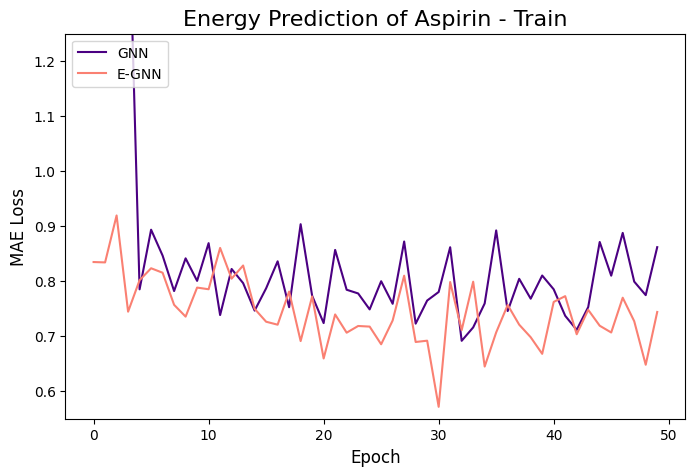
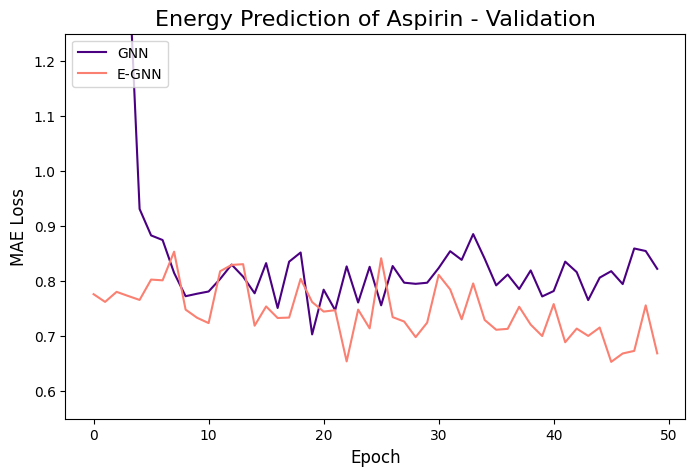
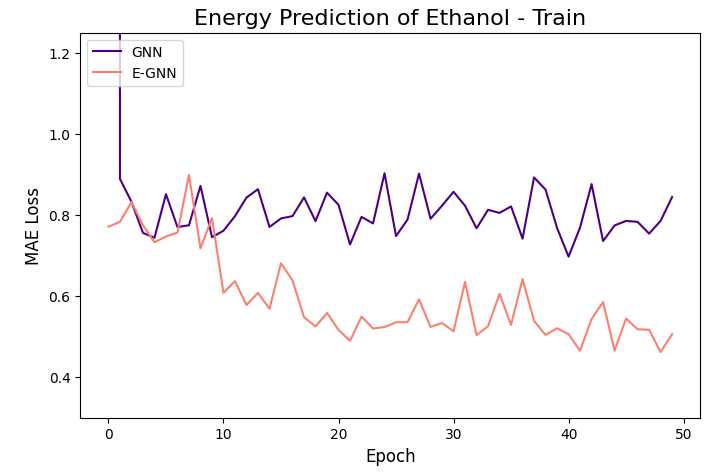
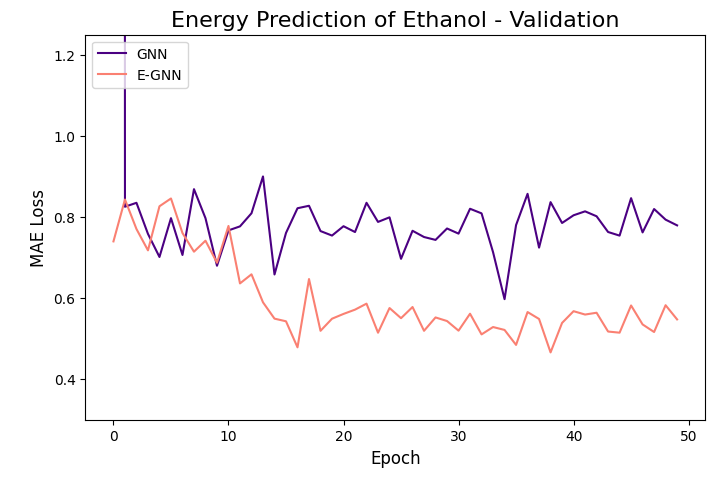
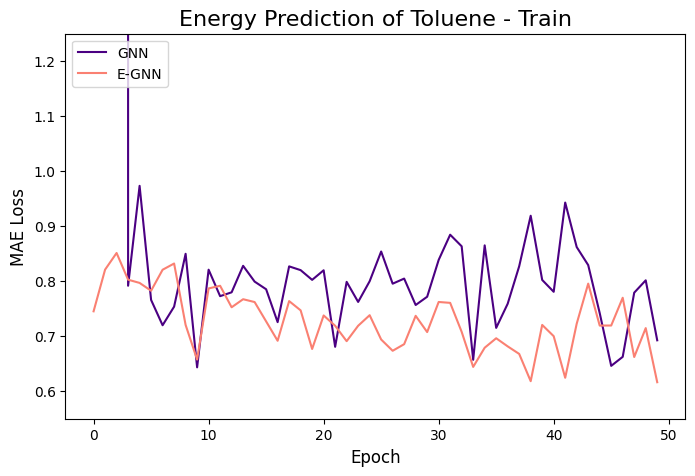
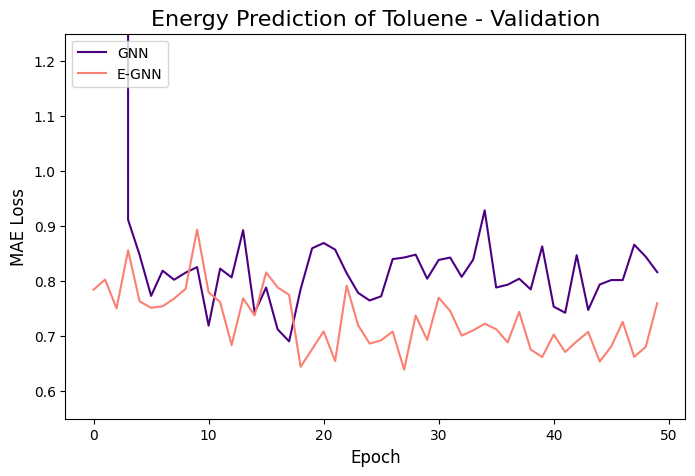
The models were trained for 50 epochs using mean absolute error (MAE) objective for predicting normalized energy (in kcal/mol units). Adam optimizer with a learning rate of 0.01 and learning rate scheduler were employed. The E-GNN achieves a superior MAE rate for all three molecules.
Next, let’s examine the latent representation of the two models! The last layer values of the validation data of both models were projected using t-SNE to a 2D representation and color-coded according to the target energy values:
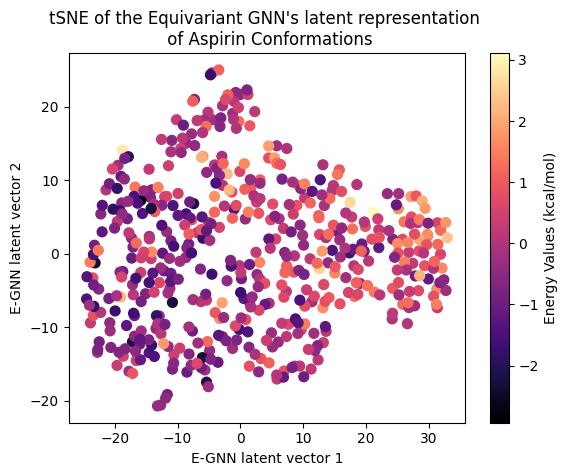
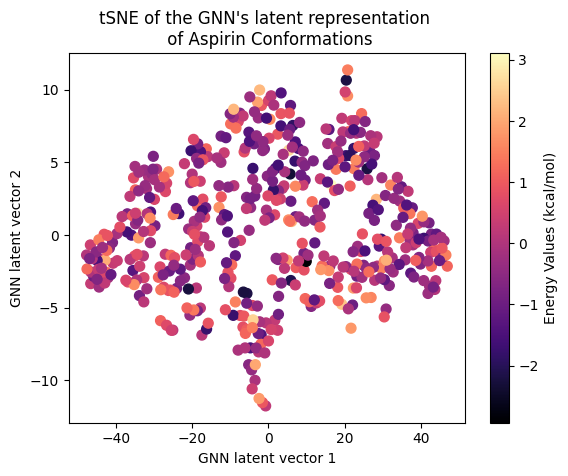
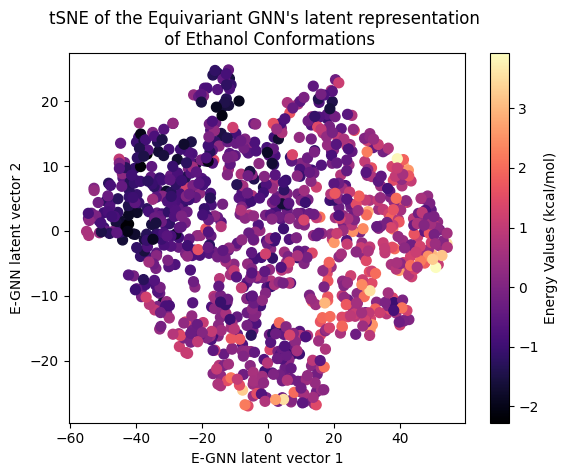
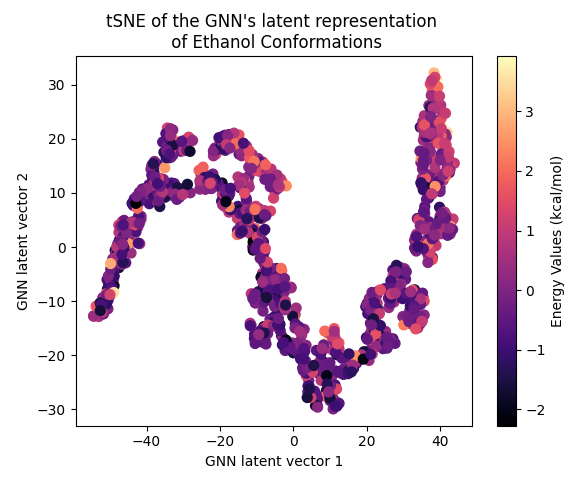
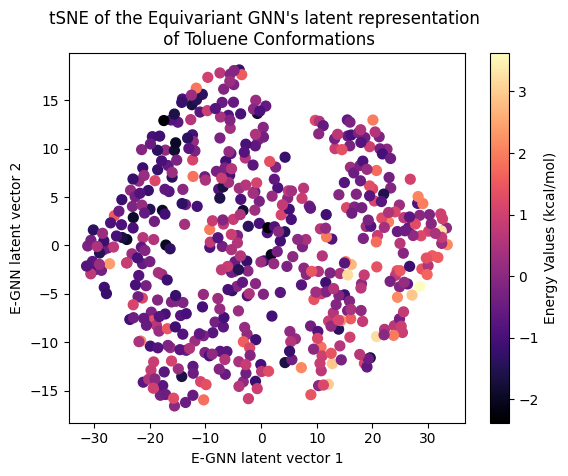
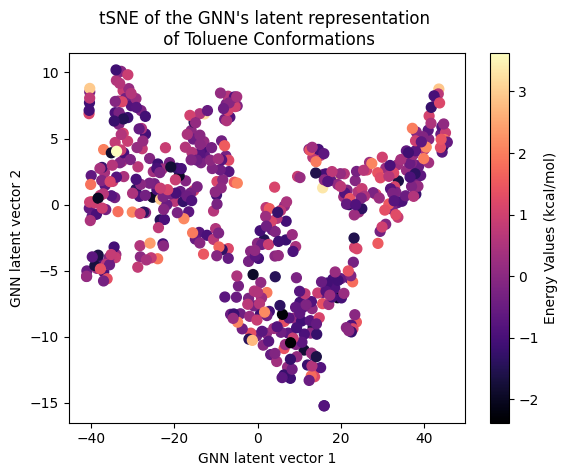
A color gradient can be seen in all three projections of the Equivariant GNN; and it is the clearest for Ethanol. The Invariant GNN’s latent projections do not exhibit a similar structure, perhaps except for Ethanol’s conformations. Moreover, in Ethanol’s case, the GNN projection appears to be quite one-dimensional.
The apparent color gradient according to the target values in the E-GNN latent space is impressive, suggesting that the model leverages this information when embedding data conformations for predictions. Multiple “locations” in the latent space denote various high-energy conformations, indicating that the model considers not only the target energy value but also structural differences.
To assess whether there’s molecular structural ordering in the embeddings, we construct system-specific variables for each molecule and visualize the latent space accordingly. Ethanol, with its relatively simple structure, showcases three important variables: the distance between the two Carbons (C-C bond), the distance between Carbon and Oxygen (C-O bond), and the angle formed by the three atoms. The distributions of these variables in Ethanol’s train and validation sets are depicted in the figure below:
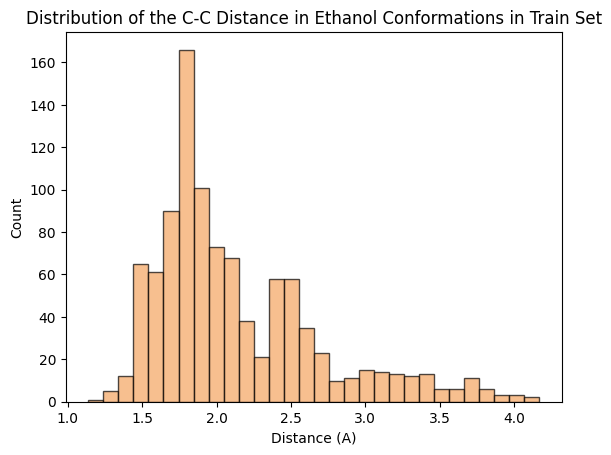
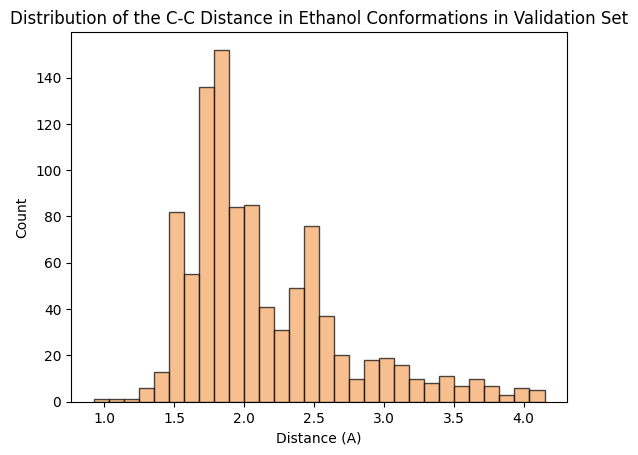
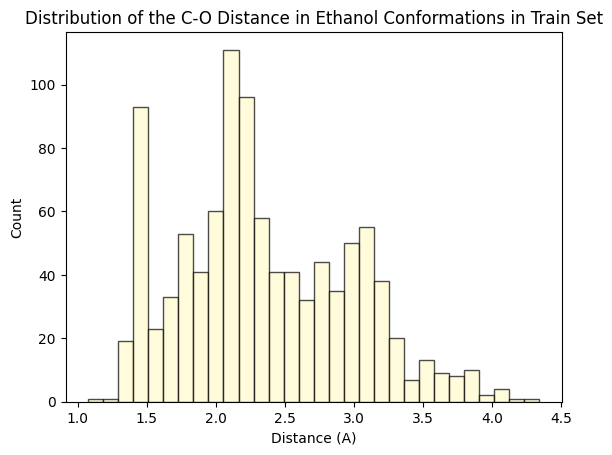
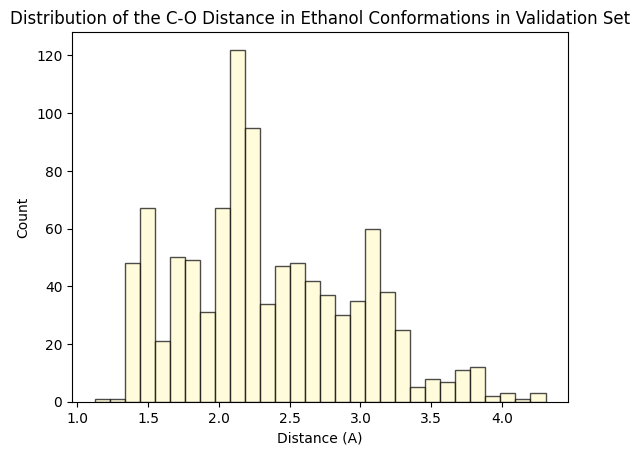
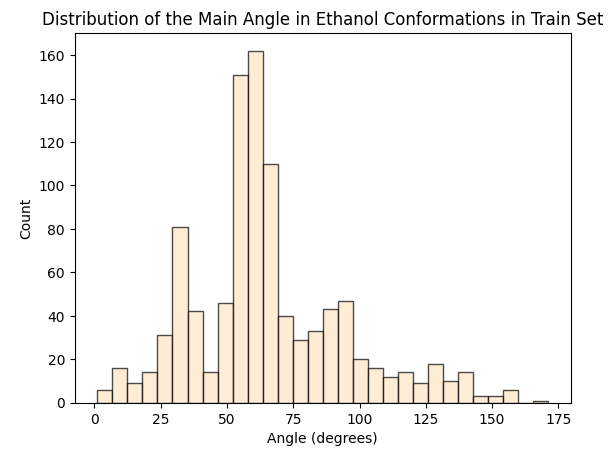
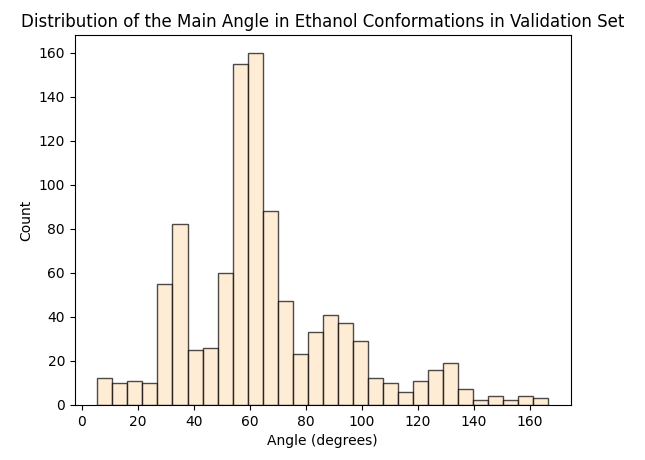
The distributions appear very similar for each variable in the train and validation sets. Now, let’s examine Ethanol’s validation conformations latent projection, color-coded with respect to the target and the three system-specific variables:

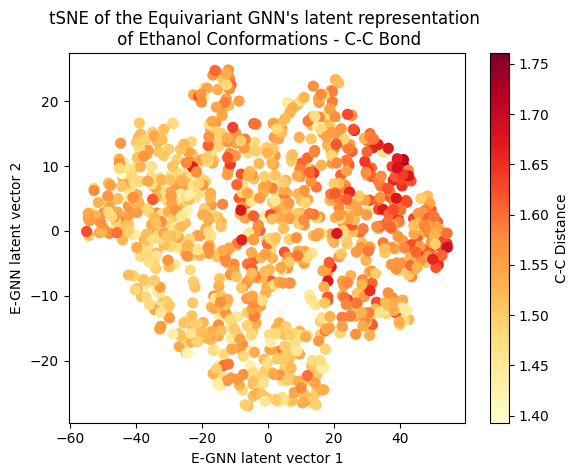
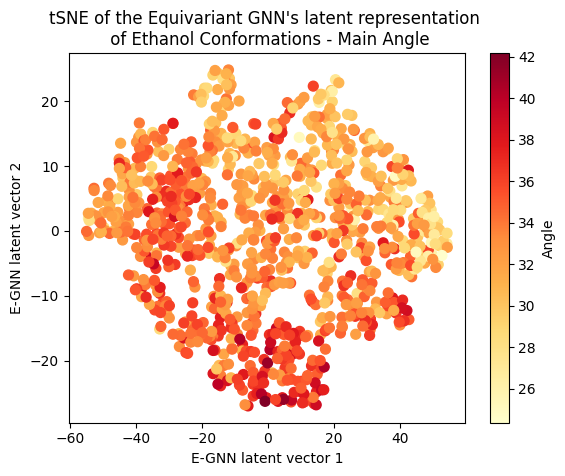
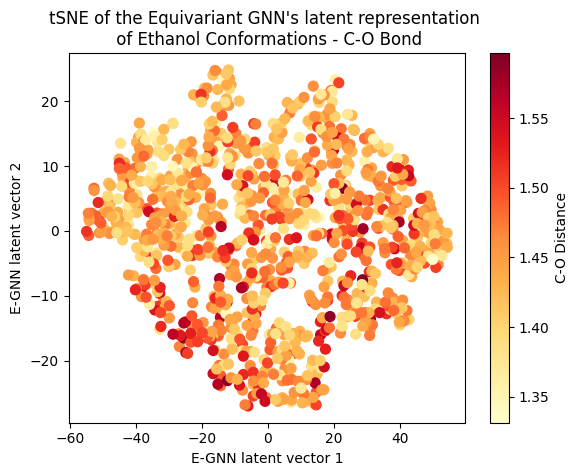
A clear gradient is observed for the main angle and C-C bond! The target gradient appears from the top left corner to the bottom right; the C-C bond gradient seems to go from bottom left to top right, and the main angle gradient isn’t as linear, appearing to spiral from the bottom to the top right corner clockwise. The C-O bond projection doesn’t seem to follow a discernible gradient, suggesting it’s not as influential on the target as the other two variables.
Cool huh? The Equivariant GNN appears to embed the data according to the target value but also according to the systems geometrical structure! This suggests that the model leverages its E(3) equivariant convolution layers to capture and encode information about both the target values and the intricate geometric features of the molecular systems.
Conclusion
In conclusion, our exploration has demonstrated the efficiency of the E(3) equivariant GNN, compared to an invariant GNN, in predicting the total energy of molecular conformations. Though both models were compared on predicting energy, a scalar propery, the E-GNN’s ability to leverage the inherent symmetries present in the system allowed it to effectively capture and encode the relationship between the arrangement of molecules and their respective energy. This was illustrated through the latent representation visualizations, and was particularly evident in the case of Ethanol. Here, discernible gradients in the latent space were observed, correlating with the target energy value and variations in C-C bond length and main angle. However, interpretability varies among the latent projections for the more complex molecules investigated in this project. Potential improvements could be achieved with additional data and a more expressive equivariant network.